WasherBot and DryerBot, Part 5: A Measurement Algorithm and Text Message Integration
24 Apr 2017Table of Contents
- Part 1: How to Tell If an Appliance Is Running
- Part 2: Current Sensors and Burden Resistors
- Part 3: Connecting to the Pi and Building a Voltage Divider
- Part 4: A Low-Pass Filter and Reading From Laundry Appliances
- Part 5: A Measurement Algorithm and Text Message Integration
As we saw in Part 4, the “thicker” the AC wave appears on a graph of our MCP3002 measurements, the more power it’s consuming. This “thickness” is a great proxy for power consumption called the “amplitude” of the wave - the distance between the highest and lowest points of the wave.
When an appliance is using no power, the amplitude should be 0. In testing, I found that jittery power can sometimes produce a resting amplitude of up to +/-6, so our actual resting amplitude turns out to be 12.
In order to find the amplitude of the 60Hz wave, we need to measure it for at least 1/60th of a second. This will guarantee that we’ve measured an entire cycle of the wave. If we run the MCP3002 at 50 kHz, then we’ll need at least 50,000/60 = 834 measurements to measure a full cycle.
This will only let us measure a 1/60th of a second time period, though. Maybe the appliance isn’t using much power during that tiny window. If we increase the amount of time we’re measuring for, we can get a better assessment of power usage.
Let’s arbitrarily pick 7500 measurements. That’s just about 9 cycles, or 3/20ths of a second.
We can see that measuring for just 3/20ths of a second will accumulate a lot of data. If we want to do meaningful work with this long list of numbers, we need to simplify it down to a single representation of state.
State is a concept from computer science. When we say something has a state, we are describing the properties of that object at a particular point in time. Like on October 27th, a pumpkin might have a state of ‘picked’. Then, on October 30th, it goes from ‘picked’ to ‘carved’ and on Halloween it goes to ‘jack-o-lantern’. By November 3rd, it’s ‘rotten’.
Our pumpkin has many states, but our appliances really only have two for our purposes - ‘on’ and ‘off.’
Simplyifing the Measurement
To make a shorter list of numbers, we can take out unnecessary information from our sine wave. The ‘unnecessary’ information is basically ‘anything that isn’t a peak or a trough’ since those are the only points we care about to calculate amplitude.
We could just take the highest and lowest points of the entire 7500 item list and call it a day, but this might be a problem when there are outliers or measurement errors that are sudden spikes in the data. So we want to amplify the effect of peaks and troughs, but smooth out the effect of any one outlier peak or trough.
Make a sliding ‘window’ and every 100 measurements, find the max and min value of the 50 preceding and 50 next measurements. Taking the average of these ‘windowed’ amplitudes means that any one accidental spike will only count toward the average of its own peak or trough, and the rest of the wave cycles will push the average closer to its true value.
Notice how, in this image, a single spike makes the global maximum around 625 while the true maximum, seen over several cycles, is closer to 595. Using the ‘window’ approach pulls the average maximum closer to its true value.
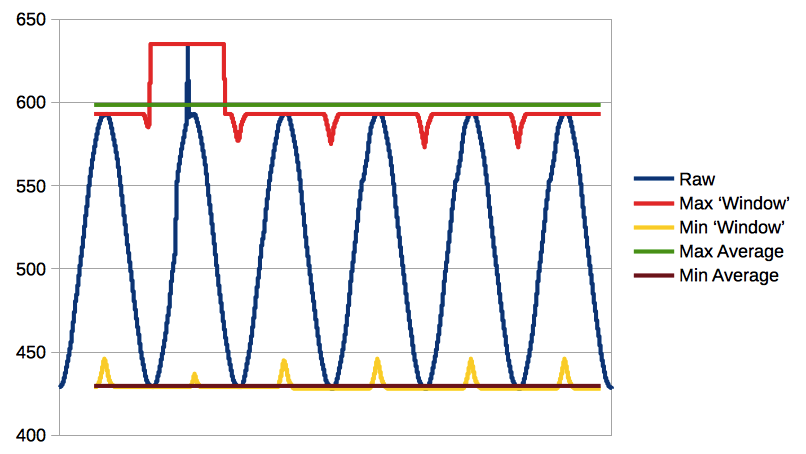
To get from an average peak / trough to an average amplitude is as easy as subracting the trough from the peak.
Finally, we come to our measurement algorithm: a function that starts off by measuring each channel 7500 times at 50 kHz and spits out a single number - an adjusted-average amplitude.
def measure(number):
    ch0list = []
    ch0avg = []
    for _ in range(1,number): #Measure n times

        ch0list.append(read_mcp3002(0))

    for step in range(50,(number-50),100): # Make peak/trough windows

        ch0max = max(ch0list[step-50:step+50])
        ch0min = min(ch0list[step-50:step+50])

        ch0avg.append((ch0max - ch0min))

    ch0 = reduce(lambda x, y: x + y, ch0avg) / len(ch0avg) #Calculate the average amplitude

    return ch0

print measure(7500)
Let’s have a look at some real-life amplitude measurements during a washer and dryer cycle:
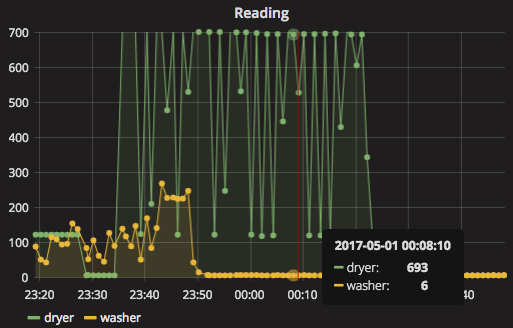
At rest, each appliance usually has an average-adjusted amplitude of 6.
From Amplitude to State, and Keeping Track of State
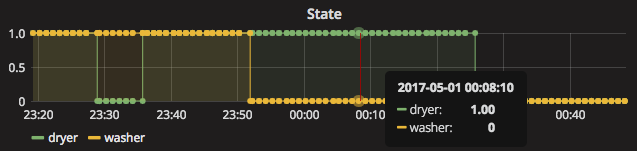
So then, to get from amplitude to appliance state is not a taxing calculation: Any amplitude greater than 12 is ‘on’, anything 12 or less is ‘off’
We set up our measurement script to run once every minute and find the current state of the appliance. But the script only knows what the appliance is doing this very minute. How can we find out what it did in the previous minute?
For that, we’ll need a database. InfluxDB is a great choice for this application, as it’s designed for measuring things over time.
So to add to our script that runs each minute, we’ll write the measurement and state to the database:
#!/usr/bin/python
from influxdb import InfluxDBClient

USER = 'root'
PASSWORD = 'root'
DBNAME = 'db'
HOST = 'hostname'
PORT = 8086

client = InfluxDBClient(HOST, PORT, USER, PASSWORD, DBNAME)

client.create_database(DBNAME)
client.switch_database(DBNAME)

mm = measure(7500) # As defined above

statemin = 12
state = 1 if (mm>statemin) else 0

newpoint = [{
    "measurement": "voltage",
    "fields": {
        "washer": mm
    }
},
{
    "measurement": "state",
    "fields": {
        "washer": state
    }
}]
client.write_points(newpoint)
We can now keep track directly of when an appliance is on or off:
Comparing States and Taking Actions
Now we can compare the current state to the previous state.
Most of the time, we’ll find that the state is unchanged. An appliance in motion tends to remain in motion, and an appliance at rest tends to remain at rest. But occasionally, we’ll find that the state is different - the appliance started up or the appliance powered down.
So we have to get the last known state:
#!/usr/bin/python
query = "SELECT * from state GROUP BY * ORDER BY DESC LIMIT 1"
result = client.query(query)
resultlist = list(result.get_points())
lastknownstate = resultlist[0]['washer']
Now we compare the last known state to the current state:
#!/usr/bin/python
different = 0
statemin=12
currentstate = 1 if (measurement>statemin) else 0

if currentstate != lastknownstate:
    different = 1
    #Do stuff
There are two possible state transitions: ‘on’ to ‘off’ and ‘off’ to ‘on’. We’ve called these ‘powering up’ or ‘shutting down’. I only want to get text messages when an appliance shuts down - after all, when it turns on someone is standing there pushing the ‘on’ button.
To get text messages from our Python script we’ll use the awesome Twilio Python REST API.
#!/usr/bin/python
import datetime
from twilio.rest import TwilioRestClient
import pytz
from datetime import datetime

account_sid = "xxxxxxxxxxxxxxxxxxxxxxxxxxxxxxxx" # Your Account SID from www.twilio.com/console
auth_token  = "xxxxxxxxxxxxxxxxxxxxxxxxxxxxxxxx"  # Your Auth Token from www.twilio.com/console
twilioclient = TwilioRestClient(account_sid, auth_token)

numbers = ["+15555555555", "+15555554444"] # Your intended SMS recipients

currenttime = datetime.now(pytz.timezone('US/Central')).strftime('%-I:%m %p') # The time like '6:10 PM'
if (currentstate != lastknownstate) and currentstate == 0: #Only do this when the appliance turns off
for n in numbers:
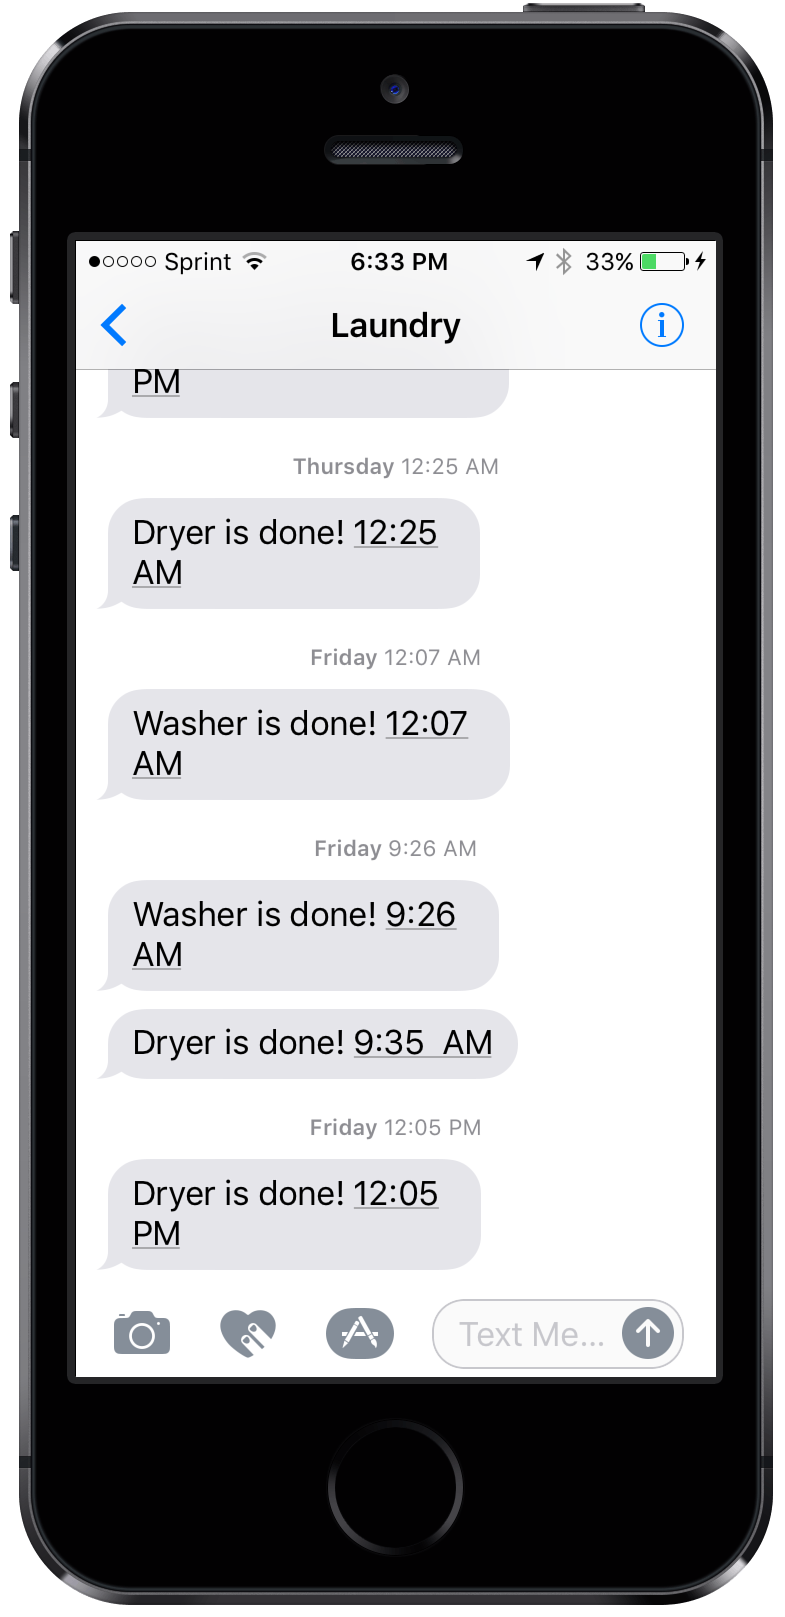
twilioclient.messages.create(body=("💧 Washer is done! " + currenttime),
to=n,
from_="+15555553333") # Replace with your Twilio numberNow I’m happily enjoying my laziness and a prompt turnaround on laundry: