
Homebrew Temperature Monitoring
25 Oct 2013A few weeks ago, I embarked on a project to monitor the temperature of my homebrews as they ferment and bottle-age.
The Data
In order to record temperatures, I ordered 3 TEMPer temperature-logging modules from eBay. These were recommended by lots of homebrewers on HomeBrewTalk as cheap and effective, although occasionally users reported large variances in temperatures and DOA sensors.
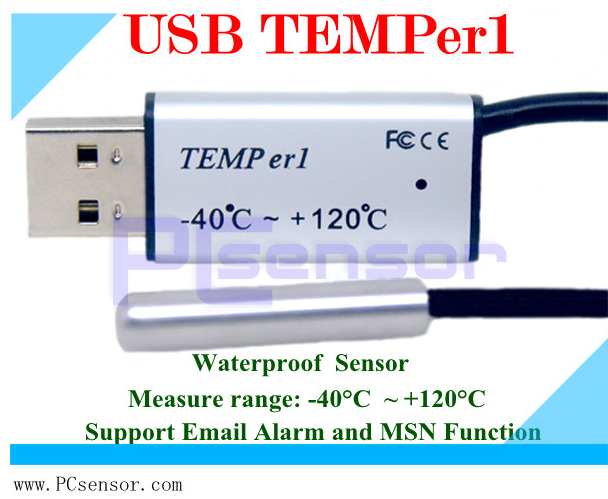
These are manufactured by PCsensor.com, which provides a linux command-line client to read the data of the thermometer.
I ordered three, and hooked them up to my brewery server.
The First Hiccup
The problem I encountered is that the pcsensor software was only designed to display one result at a time, and wasn’t configured for displaying multiple sensors. Luckily, I found a fork of the project that had been edited to allow that by following this guide
Using lsusb | grep TEMPer, I was able to confirm that the computer was reading my sensors. I installed the pcsensor-multi software:
wget http://momtchil.momtchev.com/files/pcsensor-1.0.0-multi.tgz
tar -zxvf pcsensor-1.0.0-multi.tgz
cd pcsensor-1.0.0
make
(note: a backed-up copy of the pcsensor program can be found here)
And moved it into /usr/bin/local.
Logging Temperatures
At this point, I could enter the pcsensor command and get output:
2011/12/08 14:09:16 Temperature 65.19F 18.44C 2011/12/08 14:09:16 Temperature 61.59F 16.44C
But I wouldn’t be around all day to check out the temperatures. I set up a cron job to write the temperatures to a log:
# m h dom mon dow command
* * * * * /usr/local/bin/pcsensor >> /home/fred/temperatures.log
This reads as: ALL minutes (m) of ALL hours (h) of ALL days of the month on ALL days of the week, run the pcsensor program and add the output to the file “temperatures.log”. So, every minute, the server adds temperature data to the log.
Graphing the Data
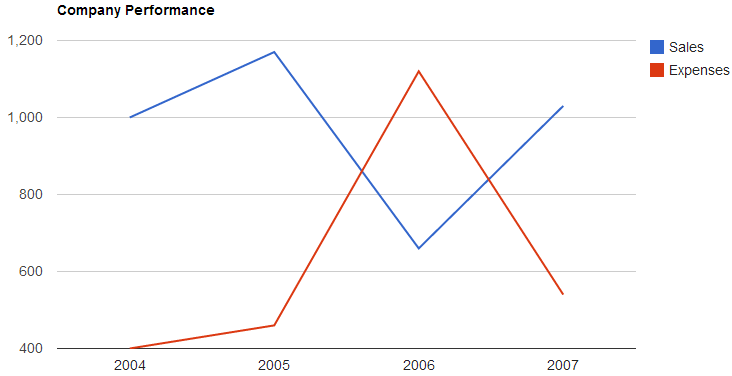
The Penguins Unbound link uses gnuplot to graph the data, an approach that I might take up in the future. However, I wanted to use the Google Charts API to generate my graphs.
To be continued: the exciting saga of why you don’t try to parse thousands of lines of text as a time-series database.